Designing By Numbers: Data Analysis for Web Designers
Judging what’s best for an audience is never far from the web designer’s mind. The ability to predict whether a web design will soar like an eagle or sink like the Titanic is among the most subjective and complex measurements you will encounter.
While resources that explain best practices exist, and your visitors contacting you about serious issues and offering you feedback relating to your site will occur if you have the proper mechanisms in place — it’s ultimately your responsibility to be proactive and research, investigate, and determine the what, why and how to ensure widespread usability.
Designing by Numbers
Before we examine the types of statistical information you should be looking at — and the relevance they have to your web design projects — we first need to go over the 3 single-word questions that relate directly to all the design decisions you will make.
These 3 questions are ultimately at the heart of your research, analytics and motivation behind designing by the numbers.
What, why, and how is a simple design process that:
- Defines what the issue is
- Proves why it is an issue
- Determines how to fix the issue with the optimal solution (if it is an issue)
What?
Of all the questions that may enter the mind of a web designer, "What?" is probably the word that relates to the task at hand. The process of understanding relevance and the usefulness of information explicitly relates to the decisions we undertake.
- What do site users need?
- What things frustrate site users?
- What can I do in this design to accomplish the site’s objectives?
- What’s wrong with the site?
- What’s right about the site?
- What can be made better?
Asking "What?" will yield to a lot of information that will help you make optimal design decisions.

What your audience requires is a fundamental principle of designing by numbers. Get Satisfaction is a feedback tool you can use to help you design by the numbers.
Why?
Next on the list of list of determining factors is the question of "Why?"
Because making changes or implementations beyond what you initially set out to achieve may cost time, money or resources — the ability to back up your ideas with hard data and facts will be enough to even make the bean-counting bosses go weak at the knees and take your professional guidance and ideas more seriously.
- Why are people not using the comments?
- Why is the community participation on the site low?
- Why are users having trouble finding what they need?
- Why do we need to support Internet Explorer 6?
Knowing what needs to be done is one thing — knowing the justification to why it needs to be done is another.

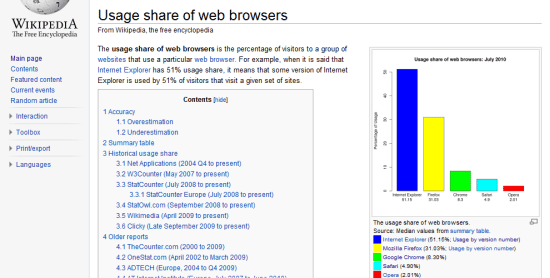
Reasons for why cross-browser support should be implemented can easily be seen when you calculate the percentages of users that use certain browsers.
How?
The last single-word question is "How?" which makes sense in that once you know what needs doing and why it’s required, the method of actualizing the "What" is important.
- How should I go about increasing user engagement?
- How can this design improve community participation?
- How can I fix the issue of users not finding the product they need?
- How can I create a design that works in Internet Explorer 6?
Statistical/Gathering Methods
When determining the best course of action for your visitors, there are 3 essential statistic types that will come into play in helping to answer the "what" question. (We shall come to the "how" and the "why" later on, so don’t worry!)
Each of these data gathering techniques have their own benefits and pitfalls so there isn’t ultimately a perfect solution.
However, designers wanting a well-rounded experience would be better off using a mixture of all 3 as they not only give you a range of quantitative results (raw numbers) but also qualitative research (such as open-ended responses and feedback).
On-Site Data
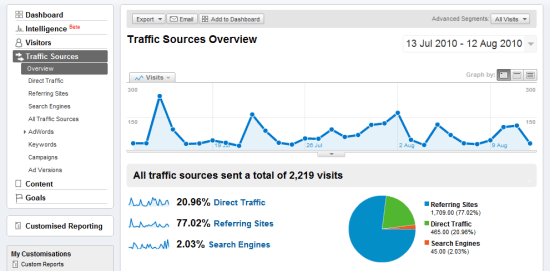
On-site data are the kind of information you obtain from website analytics software and monitoring user activity on your website.
While this type of data is often ideal in that they relate directly to your visitors, it often takes a while for activity on a new website to build up — and as such, depending on these alone may leave you in the dark as to your visitor’s basic primary needs upon launching the service.
In sites with limited or no traffic, or sites that are still in development — analytics software fails because there is no (or limited) data sources; you’re pretty much in the dark.

Most websites have some kind of visitor tracking mechanism installed, such as Google Analytics.
Third-Party/Generalized Data
Independent data are often the most useful to new websites, usually produced by large firms who provide demographic services like Net Applications or W3Counter.
These third-party data-gathering sites offer a glimpse at the general population, and by that, it will include useful details such as the browsers and devices they use, their country of origin, and so forth.
On-Site data gathering methods is going to be more accurate and will reflect your particular situation much better — for example, a web development blog will have a different audience than a cooking blog) — but accounting for independent statistics can aid you by providing a baseline to work from, especially if you have no user base.

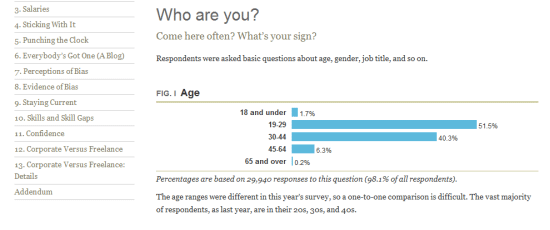
There are plenty of statistics on the web, you just need to look! The figure above shows statistics from A List Apart’s survey of web designers.
Social Data
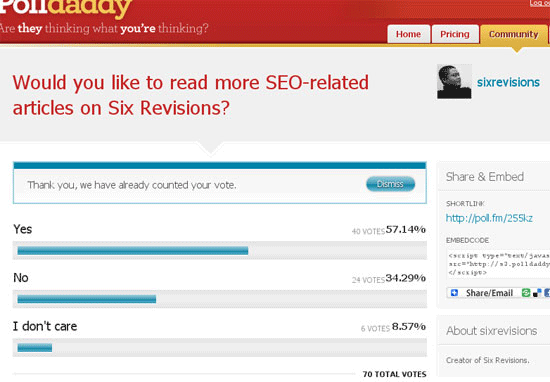
Socially-sourced data are a relatively new concept that has come out of the rise of networking sites like Facebook or Twitter, where people can promote or discuss your creation through an external site.
While there are still a large number of people who aren’t interested in the "social" aspect of social networking, the importance of leveraging these statistics of what visitors like, dislike and their comments attributing to such information can actually be more useful (in different ways) to the conventional number-based statistics from analytics packages.

Social networking can provide you with useful feedback to work with.
Designers Demographics
Now that we have covered the "what", we need to examine the "why" (and by association) the need to focus our attention on all the pretty percentages, pie charts and graphics that appear everywhere.
Ensuring your visitors can use and enjoy their experience with your web design is important and determining how we can provide that experience will all be down to using the statistics methods above and then narrowing the focus down onto what is most relevant for your audience.
While pretty numbers may seem impressive on their own, they’re not worth anything if they don’t speak to your niche, so successful sourcing of your data is critical.

Review websites are notorious for having subjective criteria of questionable validity.
If you’ve exhausted local statistics and have a general idea of the visitors you’re getting (and perhaps where they found you), and if you’ve gone further afield to seek out related demographics relating to research on an area which affects your niche, its worth going beyond the number crunching and seeking out "intelligent hits" that may help guide your decision making. Asking your community (or perhaps your competitions if you don’t have one!) what would enhance the experience can be great, just don’t try to please (or annoy) everyone and only implement what will benefit your users!

Getting to know your visitors can simply be a matter of knowing how to communicate.
With all of this information in regards to what you’re investigating the "why" (as in why changes need to be made) will become quite apparent. While it may seem natural, it’s quite easy to become so fixated on the number of visitors or re-tweets we get, that we actually ignore the most important thing a statistics package (or some solid research) can tell us – that our visitors will have their own specific set of needs and requirements that need addressing. As a final point on the matter of "why", if we don’t actively seek out ways to improve ourselves, we can’t hope to gain new customers.
 Visitors may have JavaScript disabled which could leave them excluded from statistics.
A Quick Measurement
The next thing to take into account is how to filter the information once you’ve collected it (which meets the "how" element). Having lots of statistics and ideas may help, but filtering the stream of data will be critical to making sense of the best route to take in fixing a common problem or deciding the next step. The simplest way to prioritize your data is to follow the below, the higher up on the list the item is, the better and more potentially useful and reliable your research will be. Once the best information is extracted, you can refer to the numbers when making decisions for the design.

Determining the quality of your information is a mission critical part of the process.
Importance of Location:
- Local
- Independent
- Social
Importance of Type:
- Statistics
- Research
Importance of Reliability:
- Proven
- Trends
- Unproven
Importance of Margin:
- Significant
- Proportionate
- Insignificant
Note: Using the above, a locally sourced bunch of statistics that are proven (by a significant margin) to be the best course of action would ultimately be the peak of what you can gather. Though as your research will lead to talking with customers, individual needs should be accounted for as well.
Variable Considerations
Before rounding up this article, it’s important that we consider the variables which may impact your statistics. While it’s great that there are plenty of studies that may assist you in decision making (like how to build a perfect font stack or what browsers you should support), it’s very important that we highlight the issues that will break down the cold harsh numbers and give you a little more to work with. Without making this article particularly heavy going (which isn’t the intention), the two types of variables you want to consider are mechanical and personal, and both relative to the visitor.
The first of these (mechanical) will directly affect the way in which your visitor interacts with your site, this isn’t as a result of their physical being, but more of their circumstances and equipment. In web design it’s obvious that the device used, the OS installed, the browser used, the scripting or plug-ins available or something else will affect their experience. While these are usually listed as independent statistics in packages, they are often related to each other in that a single user will contribute to a number of these breakdown listings, thereby it may directly affect the results.

Nothing forces greater demands on a website than the range of browsers that exist.
The second and probably one of the more important factors are the personal variables. The reason why these variables are so important is because they will often not appear in statistics packages and require you to undertake independent research to get the numbers or determine the viability of catering to their needs. Such factors include the accessibility level being required, the usability of a site (which won’t be a number) and the findability of information. While harder to pin down, it still makes sense to account for such variables as they directly and quite dramatically affect visitors.
Note: Error Margins also play a part in statistics, research made by a human rather than a computer can be subject to biases, errors and omissions – some of which may go unnoticed. The significance of information can also fluctuate depending on the audience who visit the site at any given time.
via: Six Revisions
Labels: Web Design


1 Comments:
This is brilliant. You can design trying to make a page look impressive, or you can read the numbers and design based on that. Thanks for the article.
Post a Comment
Subscribe to Post Comments [Atom]
<< Home